Defect Size evaluation in Eddy Current Testing through Wavelet Transform and Pseudo-color Enhancement(Submitted to IEEE Sensors Journal)
Date: April – September 2023
The purpose of this project is to invert the defect size according to the collected eddy current signal, process the timing signal through neural network and time-frequency domain analysis, and obtain the inversion result.
Highlights
- A comprehensive through-type eddy current detection system has been developed for the detection of sub-millimeter level defects and estimation of defect size.
- The combination of the continuous wavelet transform and a pseudo-color enhancement algorithm is employed to enhance the distinguishability of signals with similar defect sizes.
- CNN regression models have been utilized to achieve high-precision defect size estimation.
- This methodology can be transferred to other non-destructive testing scenarios with similar waveform characteristics.
Overview
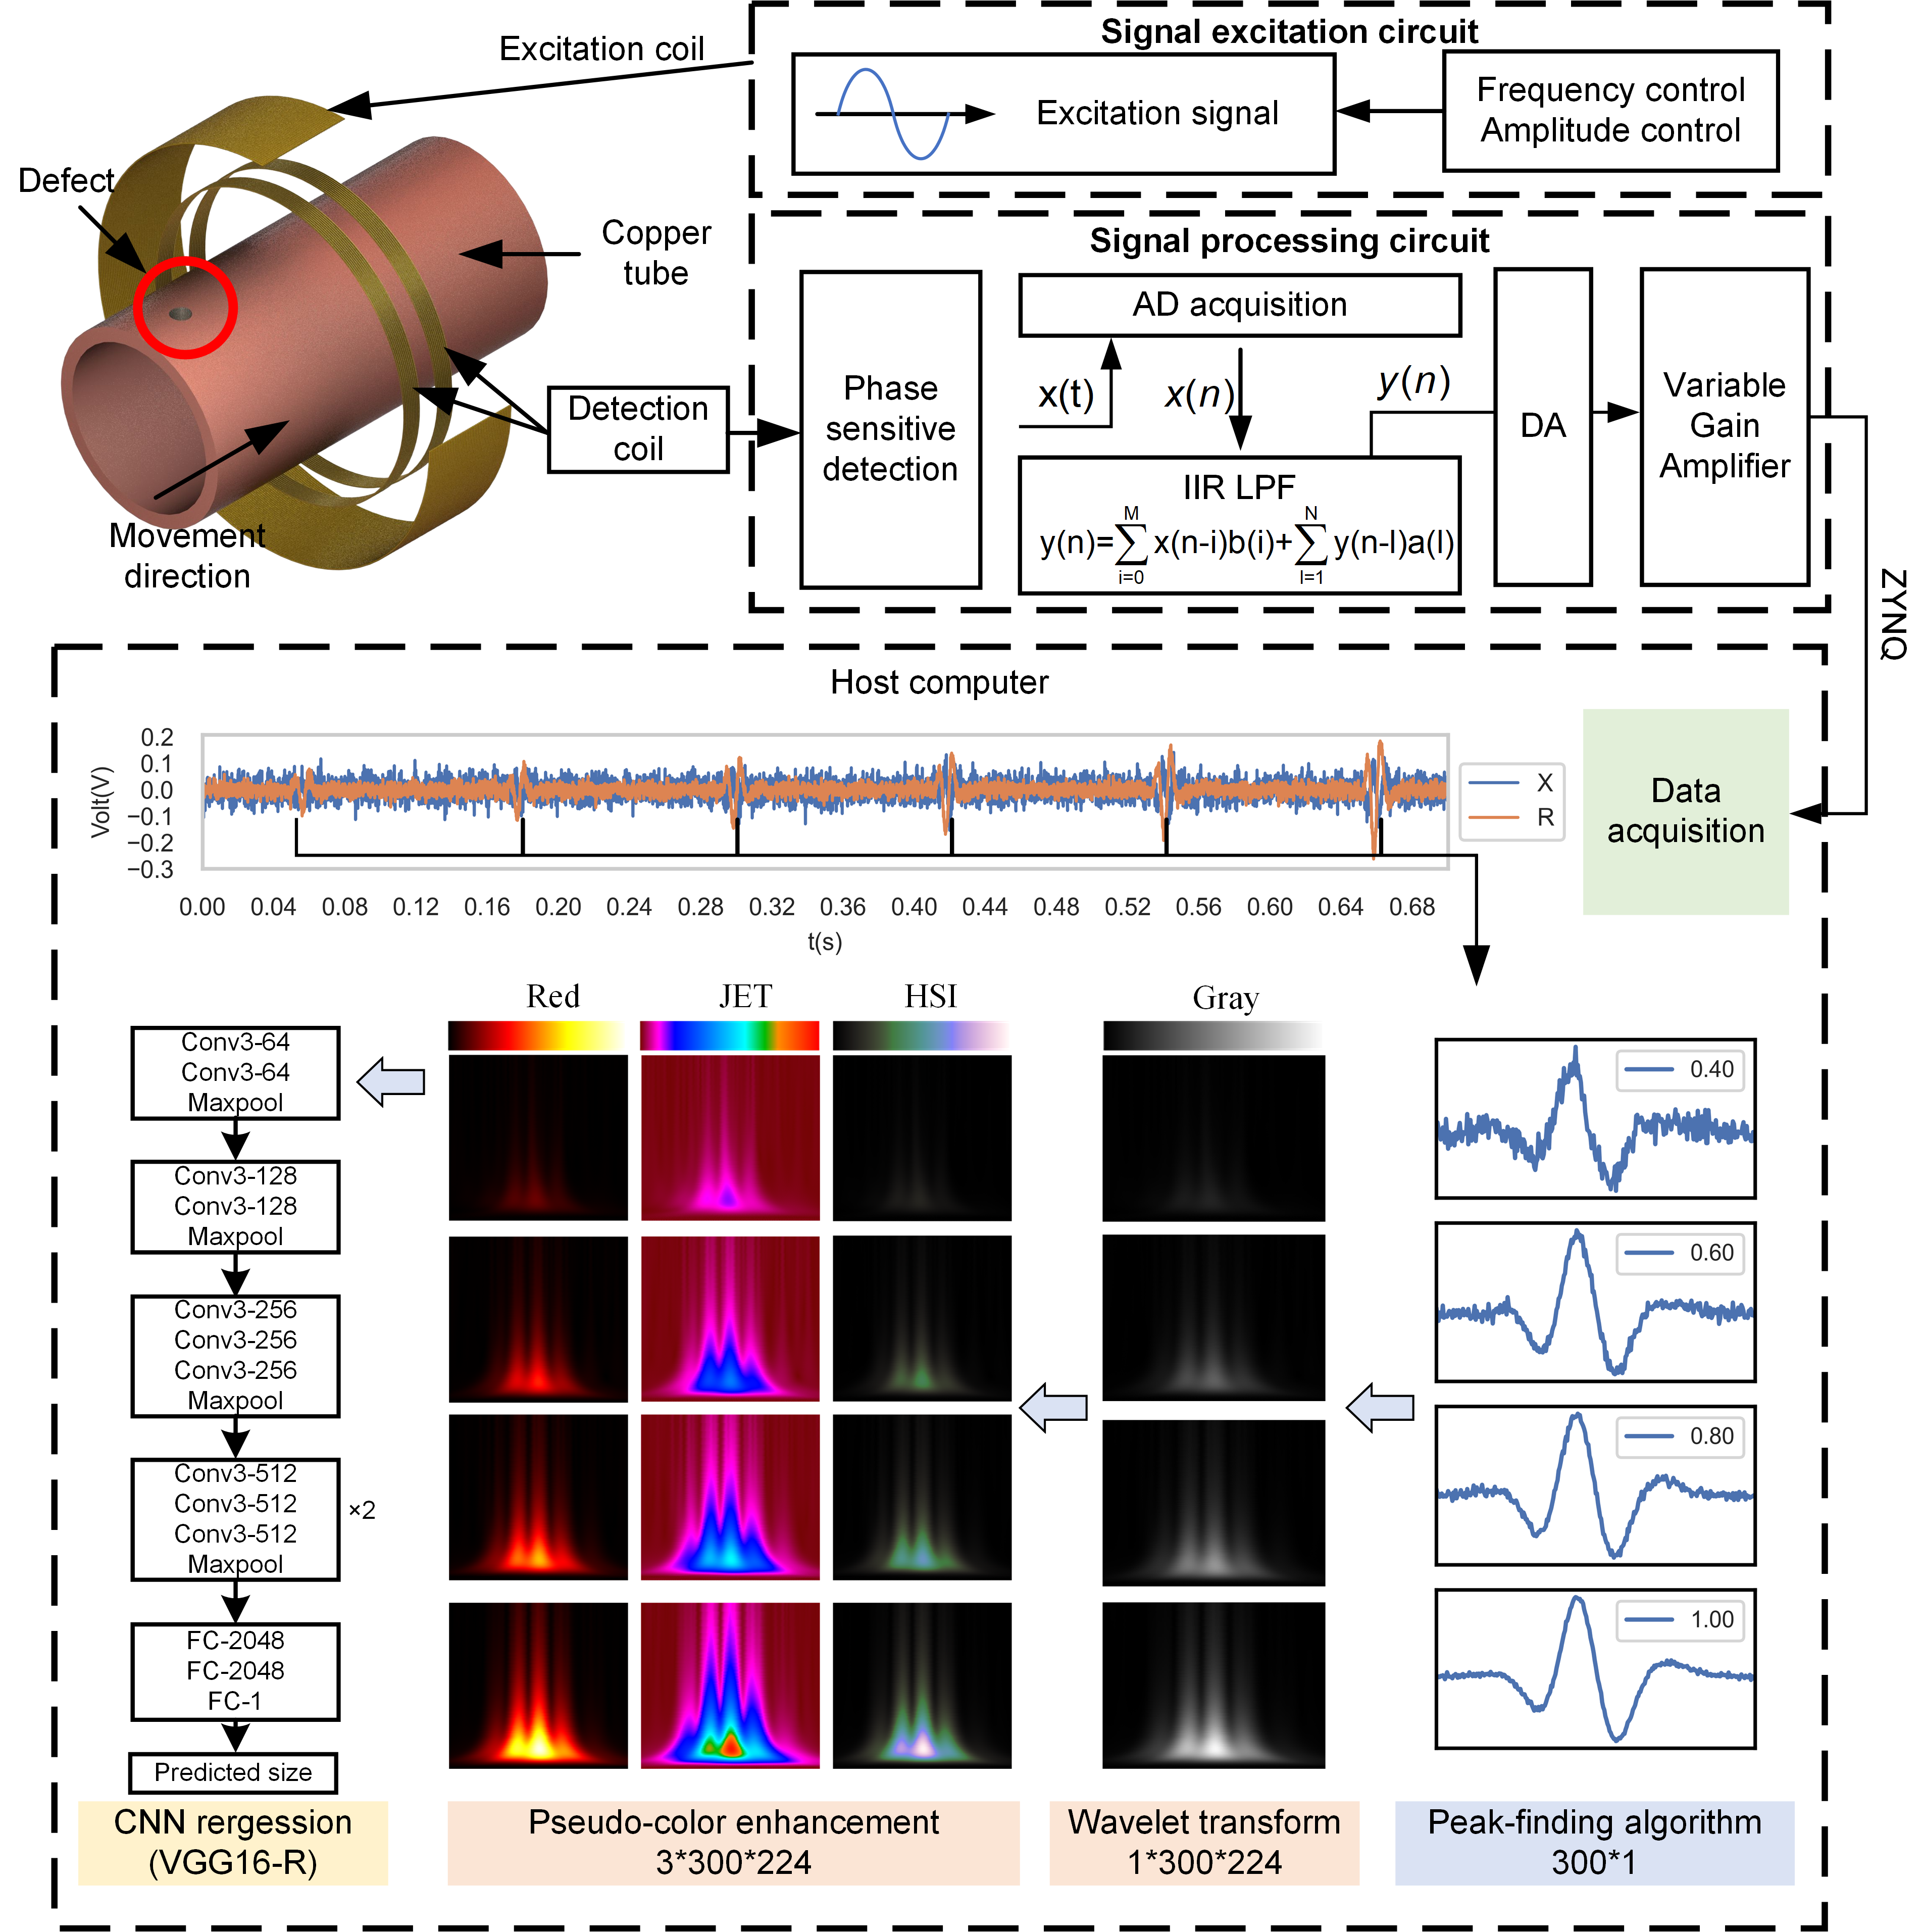
Fig. 1 illustrates the framework in the paper. The overall structure consists of two parts: the acquisition of defect signals in the hardware system and the processing algorithms for the data.
Hardware system: A through-type eddy current probe is used for detecting defects in copper tubes. The probe consists of two layers of coils: an outer excitation coil, which is responsible for generating an alternating magnetic field, and two inner differential detection coils, which are used to pick up the generated eddy current signals. The signal processing circuit utilizes phase-sensitive detection to demodulate the resistive and reactive components of the eddy current signal. This paper processes the demodulated signal using a digital signal processing (DSP) chip, employing infinite impulse response (IIR) digital filtering for more precise noise removal. The signal processing circuit utilizes an adjustable gain amplifier to amplify the detection signal. Finally, the collected signal is uploaded to the host computer via the ZYNQ-7020 chip for further algorithmic analysis.
Processing algorithm: After the host computer acquires the defect signal, the peak-finding algorithm is used to segment the defect region, and the wavelet transform is applied to obtain the corresponding time-frequency matrix of the defect signal. The pseudo-color enhancement algorithm converts the original time-frequency matrix into an RGB image in order to enhance the retention of information. Finally, the RGB image is sent to CNN regression models for calculating the defect size.
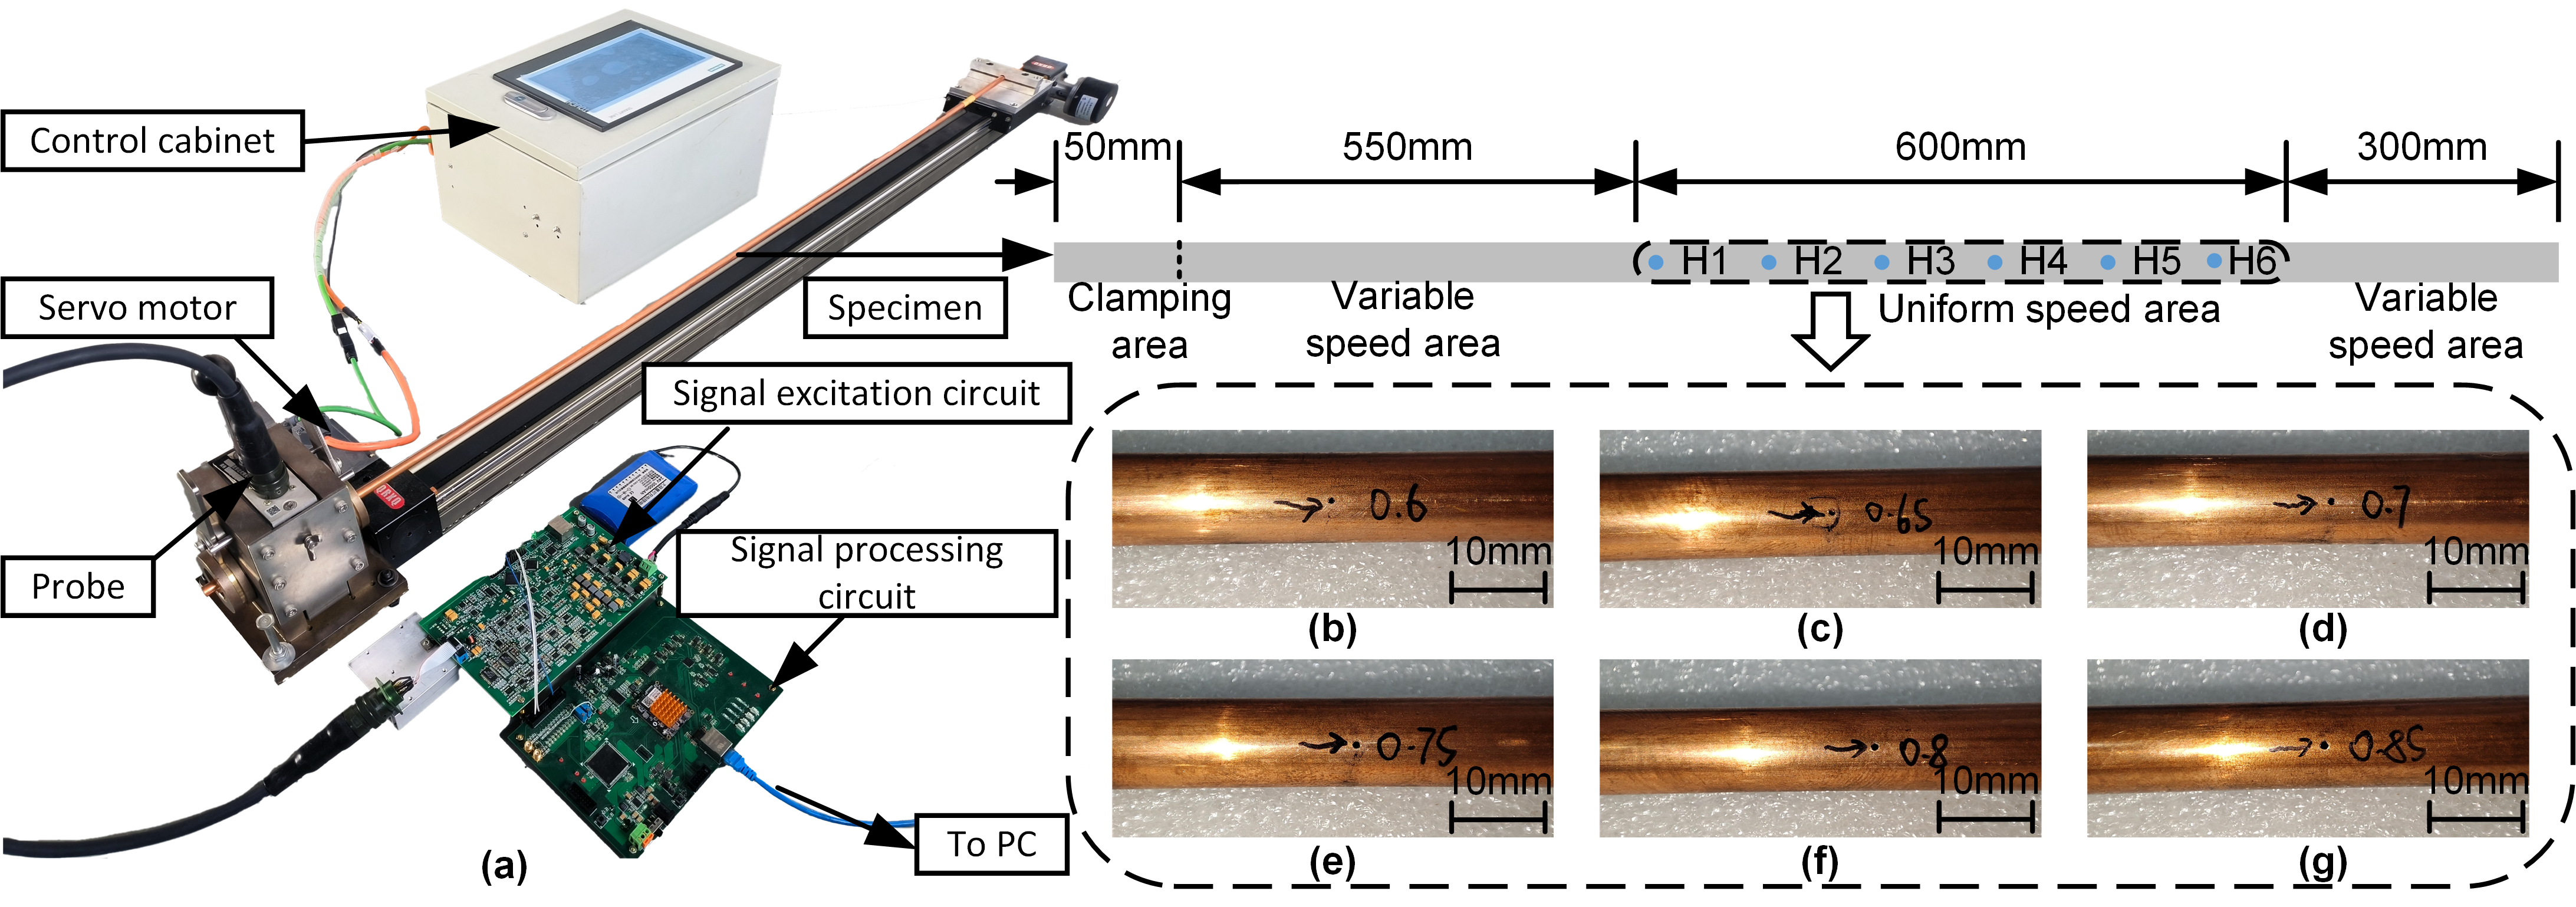
Detection System
As shown in Fig. 2, the experimental specimen is a copper tube with six evenly spaced holes machined at specific positions. The specimen in the experimental detection system is driven by a servo motor (SIMOTICS S-1FL6) to undergo reciprocating motion on a guide rail. By setting the acceleration and maximum velocity, the specimen can maintain a constant speed within the defect region.
Result
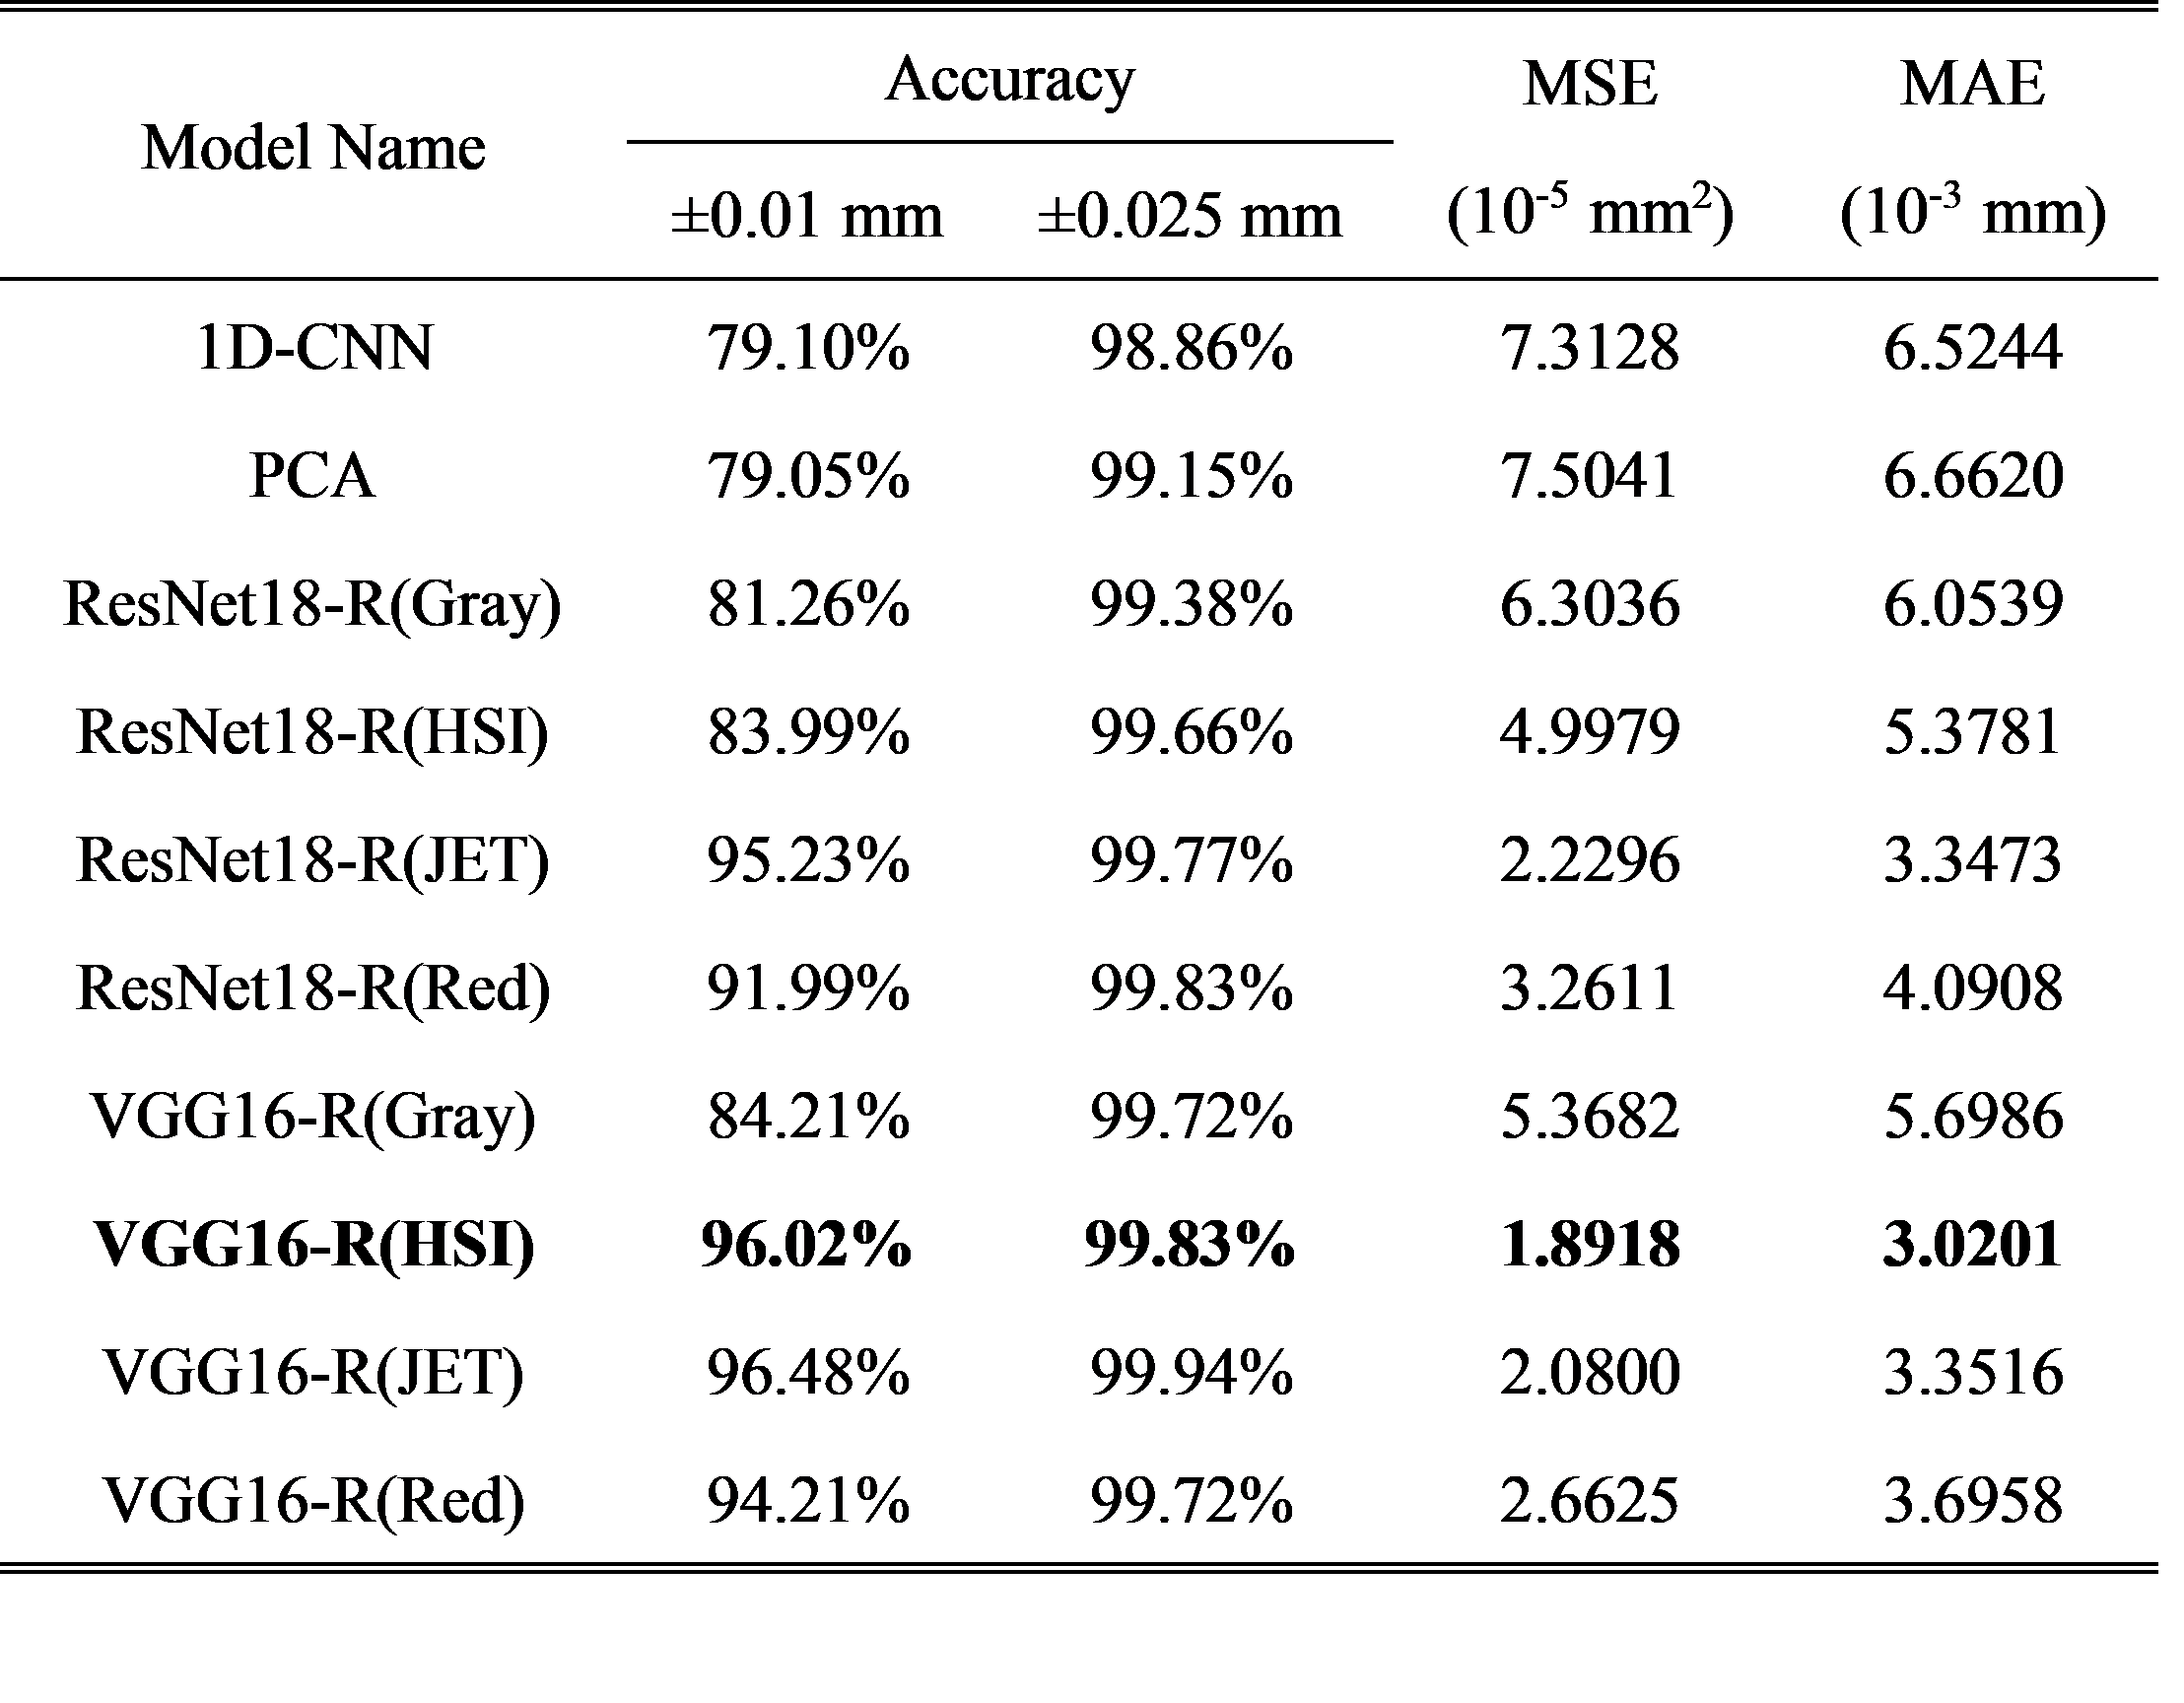
Two methods are repeated for comparison:
Method 1 [1]: Input the timing signal into 1D-CNN to obtain the size estimation result.
Method 2 [2]: Perform principal component analysis on the timing signal and input the principal component into ANN to estimate the defect size.
According to Table Ⅰ, the trained models are evaluated on the test dataset to obtain their predictions in terms of accuracy, MSE, and mean absolute error (MAE). The ±0.01 mm accuracy rate of the model is defined as the proportion of accurate regressions, where the regression values have an absolute error within the range of 0.01 mm. It is calculated by dividing the number of accurate regressions by the total number of regressions. It represents the model’s ability to accurately estimate aperture sizes with a specific precision. The accuracy rate indicates the percentage of accurate predictions out of the total predictions made by the model. This method achieves a precision of ±0.025 mm for nearly 100% of the data, meaning it can correctly classify 15 different aperture sizes. Furthermore, the predictions within ±0.01mm error range exceed 90%.
Automatic thickness recognition using pulse eddy current
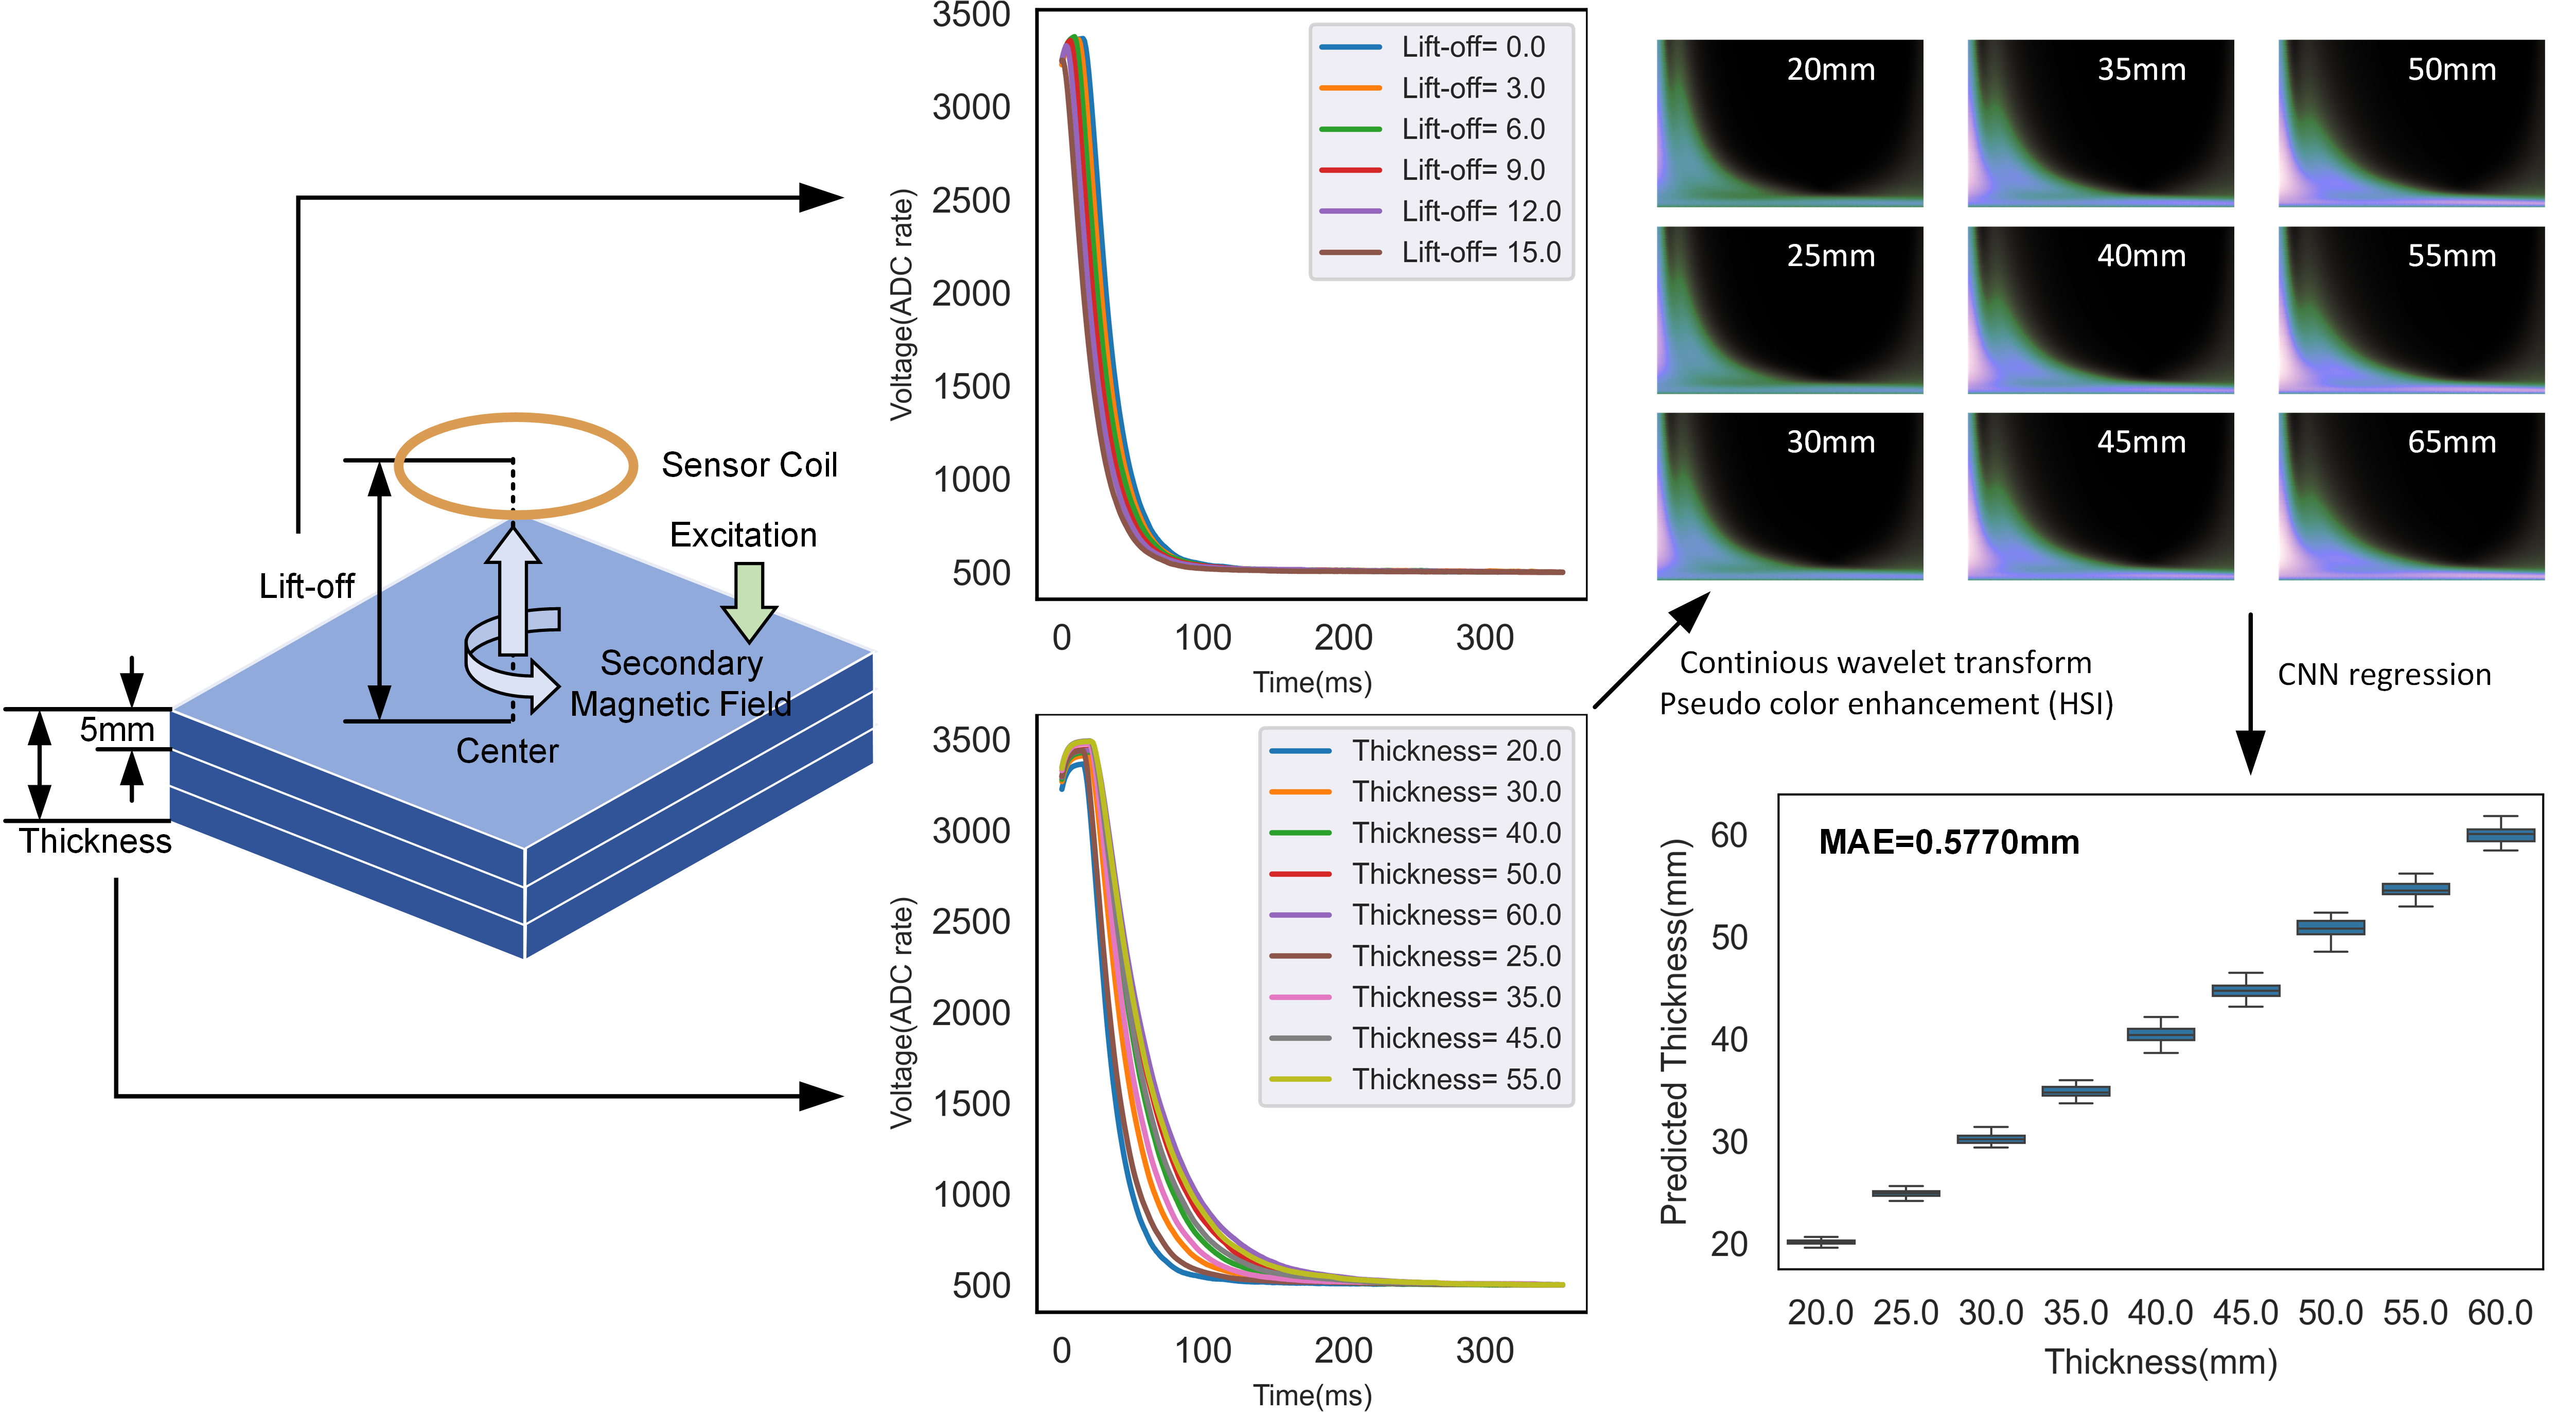
The proposed regression method can be applied to other non-destructive testing tasks, particularly in scenarios where distinguishing signals with similar waveforms is challenging. It exhibits a certain degree of scalability. Pulse eddy current (PEC) testing is utilized to measure the thickness of metal plates, and datasets for various lift-off distances are available [3].
As shown in Fig.3, the material being tested is aluminum plate, with thicknesses ranging from 20 mm to 60 mm, and lift-off distances ranging from 0mm to 15 mm.The parameters are set as described in the previous chapters, and the HSI pseudo-color enhancement algorithm is employed. We use VGG16-R to analyze the dataset. The MAE for all thicknesses is 0.5770 mm, demonstrating high-precision thickness detection.
References
[1] F. Xin, Z. Chengkai, P. Xiang, J. Lihua, and L. Zheng, “Towards end-to-end pulsed eddy current classification and regression with CNN,” 2019 IEEE International Instrumentation and Measurement Technology Conference (I2MTC), Conference Paper pp. 5 pp.-5 pp., 2019 2019, doi: 10.1109/i2mtc.2019.8826858.
[2] R. Cormerais, R. Longo, A. Duclos, G. Wasselynck, and G. Berthiau, “Non destructive Eddy Currents inversion using Artificial Neural Networks and data augmentation,” NDT & E International, vol. 129, p. 102635, 2022/07/01/ 2022, doi: https://doi.org/10.1016/j.ndteint.2022.102635.
[3] T. Meng, L. Xiong, X. Zheng, Z. Xia, X. Liu, Y. Tao, W. Yang, and W. Yin, “Real-time Automatic Thickness Recognition Using Pulse Eddy Current with Deep Learning.” 2023 IEEE International Instrumentation and Measurement Technology Conference (I2MTC), Kuala Lumpur, Malaysia, 2023, pp. 1-6, doi: 10.1109/I2MTC53148.2023.10175900.
Defect Size evaluation in Eddy Current Testing through Wavelet Transform and Pseudo-color Enhancement(Submitted to IEEE Sensors Journal)